
You spent weeks on core web vitals monitoring by compressing images, deferring scripts, and running PageSpeed Insights until the Core Web Vitals numbers finally looked acceptable. But after all that effort, users still bounce. The page loads, technically, but something about it feels off, unfinished. That’s the frustrating gap where generic page speed optimization services fall short, because chasing a score isn’t the same as mastering true Core Web Vitals optimization.
When you finally dig into the web core of the user experience through proper CWV monitoring, you begin to ask the right question: how to improve Core Web Vitals? Most guides never address honestly that Core Web Vitals optimization and user experience are not always the same thing. If you’re still relying on synthetic checks alone, you’re missing the entire point of genuine Core Web Vitals monitoring, which is foundational to effective Core Web Vitals optimization.
Whether you’re trying to figure out how to improve Core Web Vitals on a complex e-commerce build or simply trying to understand what Core Web Vitals are and why they matter beyond a Lighthouse score, this guide gets into all of it.
Understanding Core Web Vitals Metrics
Here’s the thing I’ve seen repeatedly: you can make a page “technically fast” while it still feels slow.
- The page starts painting quickly, but the hero image is late, so the user stares at a skeleton.
- The page looks ready, but the main thread is blocked, so tapping “Add to cart” does nothing for a beat.
- The layout shifts, and the user taps the wrong thing, then blames your site.
The most important mindset shift
Treat Core Web Vitals like you treat uptime because it matters most:
- You don’t “fix it once.”
- You instrument it.
- You set budgets.
- You prevent regressions.
Core Web Vitals optimization started with three headline metrics :
- Largest Contentful Paint (LCP)
- First Input Delay (FID)
- Cumulative Layout Shift (CLS)
In this article, I’ll add the 2026 reality check: why are Core Web Vitals important? If you’re wondering how to improve Core Web Vitals beyond the legacy metrics, the answer lies in shifting your focus from what was measured to what actually matters now.
1. Largest Contentful Paint (LCP)
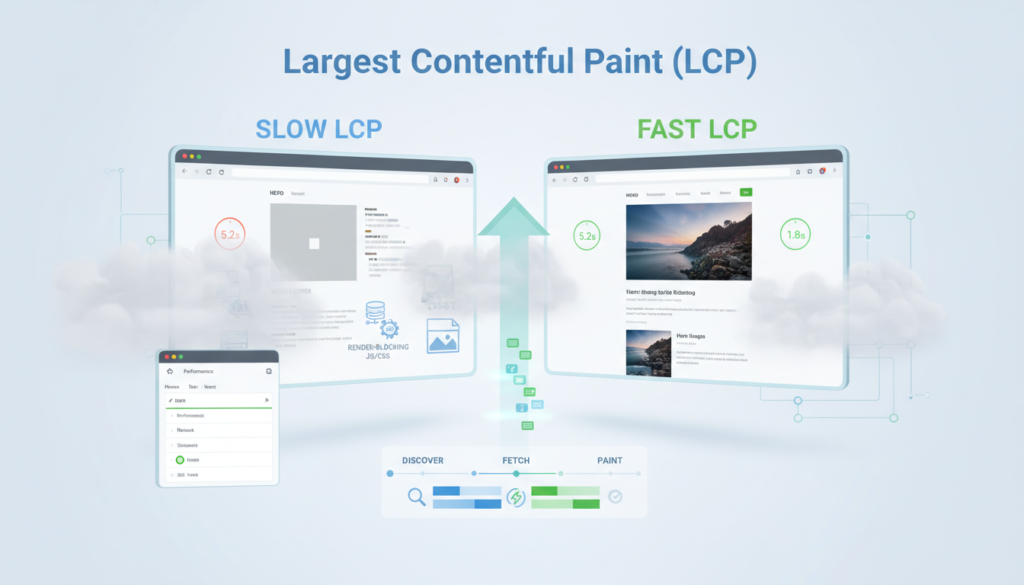
LCP measures loading performance when the largest “main” element in the viewport (often the hero image or headline block) becomes visible.
LCP must be under 2.5 seconds; Google recommends it for a good experience.
What LCP is really telling you in the real world
When LCP is bad, it’s usually one of these:
- Slow server response / TTFB problems (backend, caching, origin distance, bad CDN config)
- Render-blocking resources (CSS, JS, font loading)
- Heavy LCP element (huge hero image, video, background image)
- Client-side rendering delays (React/Vue hydration, too much JS before content appears)
If you’re trying to “improve LCP,” you’re basically trying to get the browser to:
- Discover the hero asset early,
- fetch it quickly,
- and paint it without waiting for unnecessary work.
Learn how I debug LCP without guessing
- Open Chrome DevTools → Performance and record a load.
- In the filmstrip/timings, find the LCP marker.
- Click it. DevTools will tell you which element was LCP.
- Then I jump to Network and answer:
- When was that resource requested?
- Was it delayed by something else?
- Is it served from cache/CDN?
- Is it compressed?
- Finally, I check the main thread around that time:
- Was the browser busy parsing JS?
- Is there a long task blocking rendering?
That’s usually enough to identify the top 1–2 causes.
Common LCP mistakes I see (constantly)
- Hero image loaded via CSS background-image with no preload and no priority hints. The browser often discovers it late.
- A “small” JS bundle that’s still 300–600KB compressed, but triggers seconds of parsing + execution on mid-range Android.
- Too many font variants are causing late text rendering.
- Carousel/slider libraries in the hero (they love to delay LCP).
2. First Input Delay (FID)
FID is a core vital that measures the delay between a user’s first tap or click and the browser’s ability to respond, which exposes whether your page was truly ready or just pretending to be.
Must be: Ideally, less than 100 milliseconds.
How I chase down bad FID-style issues
- Open DevTools → Performance, record during page load.
- Look for Long Tasks (anything > 50ms is already user-visible; > 200ms is painful).
- Expand the call tree. Identify:
- analytics tags
- tag managers
- A/B testing scripts
- heavy UI libraries
- Decide which path you’re on:
- Reduce JS shipped
- delay non-critical JS
- split bundles
- offload work to a worker
If you’re sitting there thinking, “But we need that script,” fine, then you at least make it not block interactivity.
3. Cumulative Layout Shift (CLS)
At the web core of user trust lies the CLS metric, which measures visual stability because nothing erodes confidence faster than a button that jumps just as a thumb is about to tap it.
Target: A good CLS score is less than 0.1.
CLS is the silent conversion killer. It’s also the metric that makes designers and product people instantly understand performance, because everyone hates layout shift. If you’re struggling with this on your content-heavy pages, specialized WordPress speed optimization services often tackle CLS at its root.
Find CLS culprits fast.
- Use DevTools → Performance and enable “Web Vitals” overlays (or use a layout shift debugging view).
- Reload and watch for “Layout Shift” events.
- Click a shift event → see the elements involved.
- Fix the category:
- missing dimensions
- late-injected banners
- font swapping
- images/ads without reserved space
The usual CLS offenders (in order)
- Images without width/height banners/promot-ratio)
- Cookie banners/promo bars injected at the top
- Webfonts causing FOIT/FOUT without sensible fallbacks
- Ad slots that collapse then expand
Advanced Techniques for Improving Core Web Vitals in 2026:
In 2026, Core Web Vitals performance wins come from doing the unglamorous stuff well, which is precisely where specialized page speed optimization services move beyond generic checklists and into architectural-level improvements that actually move the needle.
- Prioritizing the right requests
- Reducing main-thread work
- Controlling third-party scripts
- Shaping the loading sequence
Here’s what I actually do when a site needs real improvement.
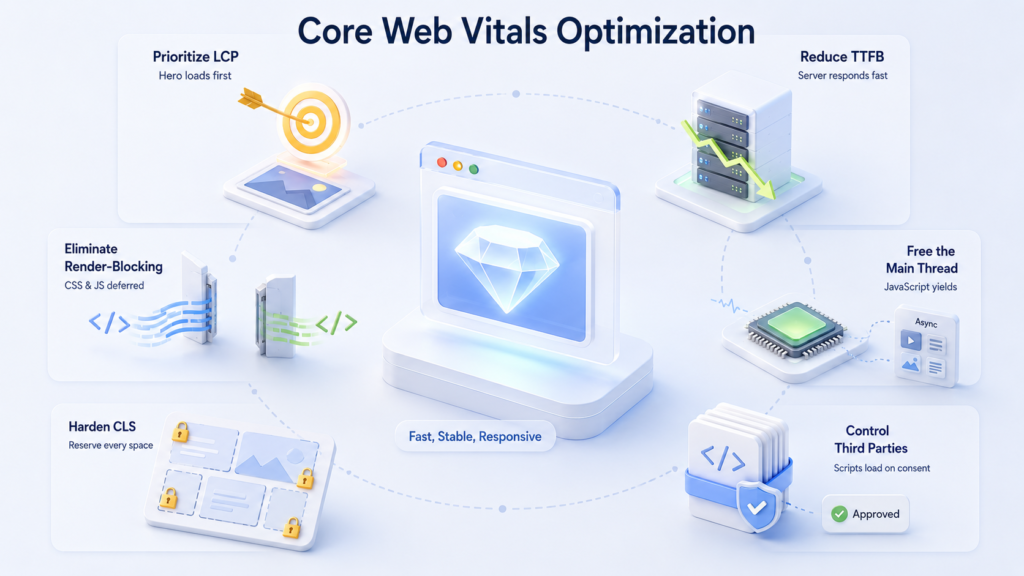
1. Make LCP better by prioritizing the hero properly
If you want better LCP, you’re usually trying to get one element to paint quickly and consistently.
My preferred approach:
- Identify the LCP element (don’t assume; it changes across templates).
- Ensure it’s discoverable early:
- Avoid hiding it behind client-side rendering, and also avoid CSS background images for critical visuals
- Use responsive images:
- Correct sizes with sensible breakpoints
- Keep it small:
- AVIF/WebP where it makes sense, and avoid retina
2. Reduce server response times (TTFB) like you mean it
People love front-end tweaks because they’re visible. But if your TTFB is bad, LCP is fighting uphill.
Things that have actually moved TTFB for me:
- Full-page caching for anonymous traffic (WordPress/Woo included)
- Edge caching with sane cache keys
- Fixing slow queries (especially “related products” and faceted search)
- Moving heavy personalization to the client after first paint (carefully)
A practical backend performance pass
- Measure TTFB by region (not just your location).
- Check cache anonymizers:
- Is HTML cacheable for anonymous users?
- Are you relying on unnecessary cookies?
- Profile the slow endpoints:
- homepage
- category/listing pages
- product pages
- Fix the top offender:
- database index
- remove an expensive plugin/module
- cache a fragment
3. Eliminate render-blocking resources without breaking the site
What I do:
- Inline critical CSS for above-the-fold layout
- Load the rest of the CSS in a non-blocking way (or split by route/template)
- Defer non-essential JavaScript
- Avoid “CSS in JS” that ships too much runtime unless you’ve measured it.
De-risking defer/async changes
- Add defer to non-critical scripts first (low risk). Trackingfy:
- Forms stiHydration
- Tracking still fires
- Then split bundles:
- Keep above-the-fold JS minimal.
- Lazy-load below-the-fold components
4. Stop JavaScript from hijacking the main thread
You need to treat the main thread like a scarce resource because it is the kind of foundational insight that answers the deeper question of how to fix Core Web Vitals issues, not by chasing scores, but by protecting the browser’s ability to respond the moment a user needs it.
Tactics that work:
- Code-splitting by route and by component
- Replace heavy libraries with lighter alternatives and remove unused polyfills.
- Move expensive calculations to Web Workers.
- Then, use requestIdleCallback for non-urgent work (with fallbacks)
5. CLS hardening: reserve space everywhere
My bias: reserve space by default. It’s boring, and it works.
Checklist I apply:
- All images have dimensions or aspect ratios
- Ads and embeds have reserved slots (even if they collapse later)
- Promo bars are either:
- part of the initial layout, or
- overlays that don’t push content
- Fonts use sane fallbacks.
6. Third-party scripts: pick your battles (and win them)
If you work on marketing-heavy sites, third-party scripts are the #1 source of regressions.
My stance: you can have third-party scripts, but they need rules.
Rules I’ve enforced successfully:
- No synchronous scripts in <head> without approval
- Tag Manager doesn’t get to load 20 tags by default.
- Heavy scripts load after user consent (where applicable)
- Each script must justify itself quarterly (yes, really)
A mini process that prevents regressions
- Add performance budgets in CI (bundle size, number of requests)
- Track real-user metrics (RUM)
- Alert on regressions (LCP/CLS or long task spikes)
This is the difference between “we optimized once” and “we stay fast.”
The Future of User Experience and Web Performance
In 2026, “performance” isn’t a separate discipline. It’s product quality.
The standards for Core Web Vitals changes are rising, and honestly, it’s not hard to see why, because most sites now draw the majority of their traffic from mobile devices. Pages themselves have grown heavier, loaded with video, personalization layers, and third-party scripts that quietly accumulate over time. All of this creates real pressure on teams that aren’t treating Core Web Vitals optimization as a daily operational habit rather than a quarterly audit someone schedules and forgets about.
Here’s what matters most from now on.
1. Responsiveness Will Matter More Than Raw Load Speed
Raw load speed gets talked about a lot, but users are sometimes fairly patient with a page that takes a moment to load because, mostly, it provides meaningful content quickly, responds to clicks and taps without any noticeable lag, and doesn’t jump around, but sometimes it lags. There’s a meaningful distinction there that many teams miss when they’re looking at how to improve Core Web Vitals scores and only chasing the headline numbers.
If your framework forces heavy client-side processing for what is essentially a simple content page, you pay for that. The performance cost is real, and it surfaces in your Core Web Vitals SEO impact, whether you’re watching closely or not.
2. AI-Driven Personalization Can Destroy CWV (Unless You’re Disciplined)
Personalization has become a default feature expectation across most product roadmaps, but the way it gets implemented creates serious problems for Core Web Vitals. Extra scripts, additional API calls, late-injected UI elements- all three of these patterns can hammer LCP and CLS in ways that are surprisingly difficult to trace back to a single root cause during a standard review.
To show just how badly this can spiral: a “personalized recommendations” feature once added 1.2 seconds of main-thread time to a page because the component shipped bundled with an entire ML-style client library that nobody flagged during review. The right fix wasn’t optimizing the component, but it was moving the computation server-side entirely and returning a plain JSON response. Simpler output, faster rendering, better results across every metric that mattered.
This is exactly the kind of regression that shows up in Core Web Vitals monitoring once the feature goes live, but it could have been caught much earlier with tracking and a performance review process baked into the development workflow from the start.
3. PWAs, AR/VR, and “App-Like” Web Experiences
Progressive web apps and immersive web experiences can be genuinely impressive when done well. If you are building something genuinely immersive, the fundamentals still apply: stable layout, predictable interactions, and a fast initial paint. Users still get frustrated by things that jump, lag, or feel sluggish, regardless of how technically advanced the underlying system is.
For WordPress-powered sites specifically, this deserves some real thought. WordPress Core Web Vitals performance can deteriorate badly when heavy app-like components load on pages where they add no meaningful value to the visitor. WordPress speed optimization services exist for exactly this reason; knowing when to pull back and simplify is often just as valuable as knowing how to build something more sophisticated.
4. The Org Shift: Performance Becomes a Release Gate
Teams that stay consistently fast over time treat performance as a non-negotiable quality standard, not something addressed when a user complains or after rankings slip.
In practice, that means performance budgets are set before new features ship, not retrofitted afterward. Automated checks run as part of the build process, not as a monthly manual review that gets deprioritized when something else comes up. It’s not glamorous work. But it’s extremely effective, and it’s the real difference between teams with a long-term handle on Core Web Vitals monitoring and teams that are perpetually scrambling to improve Core Web Vitals issues after complaints.
Looking for hands-on help making that shift?
WPGrit is built specifically for WordPress-powered businesses that take performance seriously. From one-time technical audits to ongoing Core Web Vitals consulting, the team at WPGrit brings genuine WordPress depth to page speed optimization services with Core Web Vitals optimization service, not generic recommendations you could find anywhere.
Whether you’re trying to understand the full Core Web Vitals SEO impact on your current setup or need a clear plan for how to fix Core Web Vitals issues that keep coming back, WPGrit gives you direct, actionable answers.
FAQs:
Do it in this order (because this matches how problems usually show up):
Fix CLS: reserve space for images, banners, embeds; stabilize fonts.
Fix LCP: prioritize the hero, reduce TTFB, eliminate render blockers.
Fix responsiveness and set up monitoring: cut JS, defer non-critical scripts, and remove long tasks.
If you’re talking about a single “score” (like Lighthouse 0–100), treat it as directional.
In practice, “good” means your important templates consistently hit:
LCP under the recommended threshold (often cited as < 2.5s)
low layout shift (CLS < 0.1)
fast interactivity (FID < 100ms, conceptually; and strong responsiveness overall)
If your scores are great in the lab but users complain the site feels laggy, believe the users.
Playbook for improving Core Web Vitals score:
Ship less JavaScript. Most teams ship too much.
Control third parties. Tag managers are performance tax collectors.
Make LCP predictable. Stable hero, preloaded appropriately, responsive images.
Harden against CLS regressions. Reserve space everywhere.
Measure real users. Lab tools are not your users.
A small but important habit: every time you add a feature, ask “what does this do to the main thread?” If nobody can answer, you’re flying blind.






Comments